What Is Financial Modeling?
Tables of Contents
Financial modeling is the use of accounting, finance, and business measurements to create abstract representations of an organization’s financial situation.
However, that simple definition doesn’t really explain what financial modeling is or why it’s such a critical tool for business decision-makers. The best way to illustrate financial modeling is by citing examples of how the models drive nearly all aspects of day-to-day business operations.
- A company uses a linear regression model to determine whether an increase in its advertising budget led to an increase in revenue.
- A financial analyst uses a discounted cash flow (DCF) model to find the current value of an asset as well as its potential value in the future.
- An investment banker uses an initial public offering (IPO) pricing model to set the price of a company’s IPO based on analyses of comparable companies.
Financial analysts rely on financial models to forecast future events and the impact of those events on businesses and financial systems. The power of financial models to predict the future increases as the models become more sophisticated and the data that the models use becomes more timely and relevant.
This guide describes several popular financial models, explains the corporate roles that rely on the use of financial models, and examines how to build and use financial models for a range of business applications.
How Financial Models Are Used in Business
Financial models provide business decision-makers with data-driven, quantitative assessments of where their company stands today and what its market and financial position will be in the future. Businesses and financial services use financial models to manage nearly every aspect of their operations: choosing investments; pricing securities; and planning acquisitions, mergers, and divestments.
The following are among the ways business decision-makers use financial models:
Estimating Financial Performance
Financial models use a company’s financial statements to predict its performance by building a predictive model to support business decisions. For example, as a firm’s sales increase, the costs required to generate the increase go up as well. The predictive models calculate the revenue-generating return on the increased investment in the company’s sales operation.
Determining the Value of a Company or an Asset
Various financial models are used to find an asset’s value today and in the future:
- DCF analysis
- Option pricing models
- Comparables
The models use objective and subjective measures to set the value of fixed assets, such as equipment, property, and other capital assets, as well as intangible assets, such as brands, intellectual property, and goodwill.
Analyzing Equity Investments
Equity valuation calculates the value of a company or its stock, typically using one of three different financial models.
- DCF model
- Cost model, or how much it would cost to build a replacement
- Comparables (comps) whether through common market multiples or similar market transactions
While comparables can highlight firms that are either undervalued or overvalued, it can be difficult to find companies that are similar enough to the asset being valued to provide a valid comparison. Also important is using trailing or forward multiples to calculate the impact of the firm’s recent performance and outlook for the future.

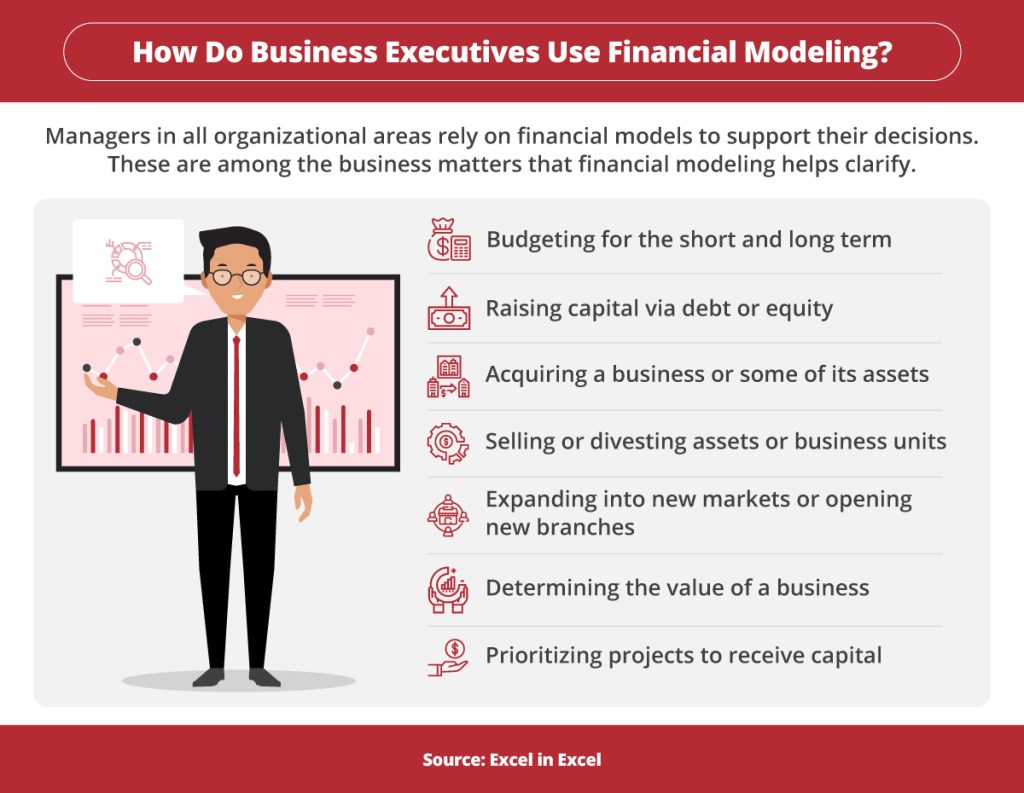
Managers in all organizational areas rely on financial models to support their decisions. These are among the business matters that financial modeling helps clarify, according to Excel in Excel: budgeting for the short and long terms, raising capital via debt or equity, acquiring a business or some of its assets, selling or divesting assets or business units, expanding into new markets or opening new branches, determining the value of a business, and prioritizing projects to receive capital.
Setting Prices
Price modeling entails knowing the psychology of the market and the value that your customers and potential customers place on products and services. While a price strategy is internal and based on the cost to provide the product, profit margin, and markup, a price model is external and based on how the product will be offered to consumers.
Financial models for setting prices factor in the customer’s perception of the price (luxury or inexpensive), the vendor’s costs and expected profit, and the price that other vendors set for similar products. The models must also consider the product’s change in value over time, seasonality, and other changes in market conditions.
Conducting Sensitivity Analyses
Sensitivity analysis is used in financial models to determine how changing values in a set of independent variables will affect a dependent variable, such as a company’s share price or the effect of an increase on interest rates. The technique is also referred to as what-if analysis and is used to estimate the impact of uncertainty in the model.
This approach is used in a range of modeling situations, including to identify break-even points, test specific scenarios, assess risk, and understand the relationship between specific input variables and output variables. In addition to finance, sensitivity analysis is an important tool for science and engineering disciplines.
Raising Capital via Debt Equity
The two primary ways a business raises capital are debt financing and equity financing:
- Debt financing relies on funds received from a bank or other lender, allowing the borrower to retain day-to-day control over the business. The interest paid on the loan is tax deductible as a business expense.
- Equity financing is received from investors in exchange for a share of the business’s profits. While the equity investment doesn’t have to be paid back, the investors may need to be consulted before business decisions are made.
Financial models for raising capital via debt or equity consider how accessible each type of funding is, the company’s current and future cash flow, and how important it is to the company that it retains control over decisions relating to the business. The debt-to-equity ratio lets a company know how well it can cover all outstanding debts using shareholder equity alone in the event of an economic downturn.
Acquiring or Divesting Businesses or Assets
When considering whether to acquire or divest an asset or business, firms look to several key financial measurements:
- Return on investment (ROI): The ratio of net profit over a period to the cost of the investment
- Profitability and cost: A product’s cost broken down by each area of the company and to industry averages
- Capacity planning: How change in a product’s demand will affect operations and finances
- Financial forecasting: Making assumptions about the future to find financial outcomes based on various scenarios
- Budgeting and cash flow analysis: Revenue and costs estimated over time, and how much cash will be on hand at any given time
Distributing Financial Resources
Much of a company’s success depends on how efficiently it allocates capital to meet its short- and long-term goals. Among the options for distributing a company’s financial resources are to return cash to shareholders in the form of dividends, to repurchase shares of stock, or to increase research and marketing operations.
Return on invested capital (ROIC) measures how well a firm converts capital into profit. The ROIC calculates the ratio of earnings before taxes or interest expense on debt to its total debt financing and equity financing, the sum of which is called its capital structure.
Managing Risk
All investment decisions entail an element of risk, so managing that risk becomes part of the financial models on which those decisions are made. Risk management applies models to quantify the potential for loss related to specific investments by identifying, analyzing, accepting, or mitigating the uncertainty surrounding business decisions.
One of the most popular methods used in risk management is standard deviation, which indicates how far apart the values in a data set are from the average of the sample: the higher the deviation, the more volatile the investment will be. Some investments will have a higher tolerance for volatility than others based on their potential for high returns.
Who Uses Financial Models?
Executives in all parts of an organization rely on financial models in their day-to-day work.
- Financial analysts typically rely on complex spreadsheets designed to serve a specific purpose, such as sales forecasts, budget allocations, and asset appraisals.
- Financial planners address the long-term financial concerns of families and individuals by applying models for retirement income estimation, cash flow projections, net worth calculations, and legacy goals.
- Chief financial officers are responsible for updating the organization’s business model to ensure it will have the resources it requires to achieve its objectives. They use financial models to identify impediments to growth, emerging risks, and new opportunities.
- Business managers use financial models to prepare budgets and make strategic plans. By modifying variables in the models, managers can forecast the business’s performance under many different scenarios.
- Project managers apply financial models while planning and implementing projects to ensure sufficient cash flow, manage project resources and schedules, and simulate various project scenarios. Many project managers use the modeling features built into the Program Evaluation and Review Technique (PERT).
- Investment bankers and portfolio managers depend on financial models to determine the fair or intrinsic value of a company’s stock, to make investment decisions based on those assessments, and to identify merger and acquisition candidates.
- Risk managers have expanded their use of financial models to include risks associated with the networks that partners and other third parties in the global supply chain use. Financial models allow firms to measure risk trends and respond faster to threats and to promote accountability for risk mitigation.
- Accountants can leverage their use of financial models to broaden their role in organizations beyond bookkeeping to include data analysis and financial decision support.
Types of Financial Models
The use of financial models has grown in recent years as more relevant and timely data becomes available and as modeling tools arrive that are easy to learn and use. In addition to helping companies estimate costs for new projects and continuing operations, the models are applied to forecast the effects of market swings and other economic changes.
Financial modeling tools are effective in tracking a firm’s key performance indicators (KPIs), including gross and net margins. Their projections are used on company balance sheets and cash flow statements, and they support the scheduling of projects and employees. These are among the most commonly used types of financial models.
Three-Statement Financial Model
The three-statement financial model is widely used in business and finance because it serves as the foundation of most other forecasts and predictive formulas. The three statements that make up the model are the company’s balance sheet, cash flow statement, and income statement:
- The balance sheet provides a snapshot of the business’s finances, including assets, liabilities, and shareholders’ equity balances.
- The cash flow statement shows the inflows and outflows of cash over a specific period in categories that include operations, investments, and financing activities.
- The income statement summarizes the business’s revenue and expenses in a specific period.
The model typically begins with the income statement, followed by the cash flow statement and the balance sheet, with the results of each analysis funneling into the other. Knowing how to apply the three-statement model is a prerequisite for many financial and management positions.
Discounted Cash Flow Model
The DCF model assesses a company’s current value based on the net present value (NPV) of its future cash flow. Under this model, the business’s value is the total of all future free cash flows (cash generated minus cash outflows for operational expenses). Investors and acquiring companies use this model to set the value of potential acquisitions, and managers use it to prepare their capital budgets and operating expenditures.
Forecasting Models
Forecasting models attempt to answer the “why” that the results of other financial models pose. The two general categories of forecasting models are quantitative (straight line, moving average, linear regression, and time series, for example) and qualitative (market research and the Delphi method that relies on the opinions of experts). Since no forecasting model can be fully accurate, the goal of the models is to be generally reliable and helpful in framing business decisions.
Comparable Company Analysis Model
The comparable company analysis method attempts to establish the value of a company based on the performance of other companies of similar size in the same or related industries. After determining the peer group to represent the company’s value, an enterprise value (EV) is found based on financial figures from its competitors. Evaluation measures include enterprise value to sales (EV/S), price to earnings (P/E) ratio, price to book (P/B) ratio, and price to sales (P/S) ratio. If the company’s valuation ratio is higher than that of its peers, it’s overvalued, and if the valuation ratio is less than its peers, it’s undervalued.
Sum-of-the-Parts Model
The sum-of-the-parts model sets the value of a company based on what each of its divisions or constituent parts would be worth if they were sold separately. The model adjusts the total to account for the company’s net debt and other nonoperating assets and expenses. The value of each separate unit is calculated using the DCF method or other valuation approach. Usually the firm’s business is spread across several industries, and it may be considering a restructuring to become more efficient. The model also serves as a possible defense against a hostile takeover attempt.
Asset and Liability Management Model
The goal of the asset and liability management (ALM) model is to mitigate the risks involved in the firm’s use of assets and cash flows, such as ensuring bills are paid on time to avoid penalties. This technique is frequently applied when managing bank loan portfolios and pension plans. Firms may find that their assets and liabilities are out of proportion due to rising or falling interest rates or swings in the interest a bank pays on deposits versus interest earned from loans. The ALM model is particularly useful for long-range financial planning.
Capital Budgeting Model
The capital budgeting model helps companies determine whether any expenditure on a fixed or intangible asset will result in a profit. The model calculates the payback period (PB), internal rate of return (IRR), and NPV. If all three of these metrics indicate that the purchase will be profitable, the buying decision becomes simpler. When the models disagree, however, managers can place a greater or lesser emphasis on the areas to gain greater insight into the purchase’s potential outcome.
Leveraged Buyout Model
A leveraged buyout (LBO) is the acquisition of a company or part of a company that’s funded primarily with debt. The LBO model determines a “floor” valuation for the asset that balances the amount of debt the purchasing firm can afford to take on with the prospects of receiving an adequate ROI. The method is used to find the maximum purchase price for the target business based on debt (leverage) and equity (return).
Merger and Acquisition Model
The merger and acquisition model is intended to find the value of a potential merger or acquisition to each company. After establishing a forecast for both firms, the model determines a range for potential purchase prices. The model indicates the value of each entity if the deal didn’t happen and the value once the proposed acquisition or merger was completed. The result is deemed to be either accretive or dilutive to the combined company’s value.
Industry-Specific Financial Models
Financial models designed for specific industries tend to be more detailed and complex than models intended to be used across industries and business segments. Among the industries that benefit from custom financial models are fossil fuels, real estate, and mineral extraction. Using these models generally requires in-depth knowledge of the target industry, so the models benefit from accurate and relevant assumptions.
Option Pricing Model
Option pricing models are used to set the price for stock options based on their value over time and various risk factors. The most popular option pricing model is the Black-Scholes model, which is related to the Black-Scholes-Merton (BSM) model and was originally developed in 1973. The model is based on five input variables:
- Option’s strike price (the price at which a put or call option — the right to sell or buy stock — can be exercised)
- Current stock price
- Time to expiration
- Risk-free rate
- Option’s volatility
The standard BSM model is used to price European options only because it doesn’t consider that U.S. options can be exercised before their expiration date. The Black-Scholes model makes many assumptions, including that no dividends are paid during the option’s life, no transaction costs are applied when buying the option, and the risk-free rate and volatility of the option are known and constant.
Resources on Types of Financial Models
- Indeed, 6 Types of Financial Forecasting Models (Plus Its Importance) — Financial models described include bottom-up and top-down financial forecasting, correlation forecasting, statistical forecasting, delphi forecasting, and ALM forecasting.
- 4-D Resources Advisory, “Natural Resources Financial Modeling and How to Make It Better” — A dynamic financial model is presented for use in the natural resources industry to enhance the accuracy of financial decisions related to natural resource management.
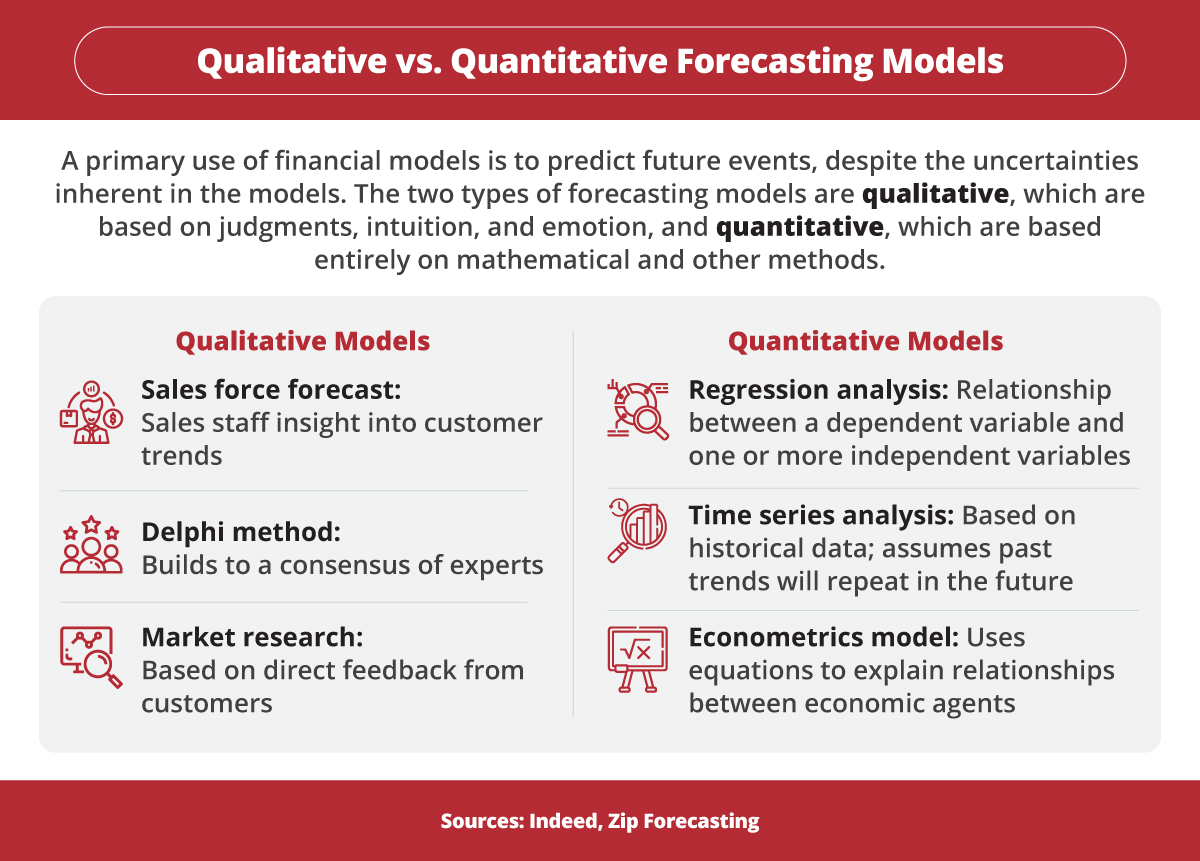
Indeed and Zip Forecasting report that a primary use of financial models is to predict future events, despite the uncertainties inherent in the models. The two types of forecasting models are qualitative, which are based on judgments, intuition, and emotion, and quantitative, which are based entirely on mathematical and other methods. Qualitative models include sales force forecast, where sales staff provide insight into customer trends; the delphi method, which builds to a consensus of experts; and market research, which is based on direct feedback from customers. Quantitative models include regression analysis, which shows the relationship between a dependent variable and one or more independent variables; time series analysis, which is based on historical data and assumes past trends will repeat in the future; and the econometrics model, which uses equations to explain relationships between economic agents.
How to Build Financial Models
Knowing how to create financial models has become a required skill for nearly all analyst and management positions in business and finance. This has led to a rise in financial modeling governance practices to ensure the integrity of models through development, implementation, and monitoring. Formal financial modeling experience reduces a firm’s liability due to improper or misleading modeling practices.
Part of the effort to formalize the financial modeling process is the effort to instill best practices in model development. The following are the six steps in the process of creating and using financial models:
Step 1: Gather Historical Data
Financial models require at least three years of a company’s financial data. The less historical the data available to the model, the less accurate the model results will be. By reverse-engineering the data, analysts can calculate revenue growth rate, gross margins, and variable and fixed costs. The results are used to complete assumptions for the forecast period.
Step 2: Calculate Ratios and Metrics
The historical data also serves as the foundation for determining historical ratios and metrics, including growth margins and rates, inventory changes, and asset turnover ratios. Four types of ratios that support business and financial decisions are profitability ratios; liquidity ratios; solvency ratios; and valuation ratios, which are also called multiples. To avoid cherry-picking ratios that present a company’s finances in the best light, ratios are typically used in combination to provide a comprehensive view from many different angles.
Step 3: Make Informed Assumptions
Historical data, ratios, and metrics serve as the basis for formulating assumptions about a company’s financial future. These assumptions help analysts calculate future growth margins and growth rates, potential asset turnover, and possible changes in inventory. Among the assumptions created are those relating to revenues and expenses, as well as working days in a year and seasonal variance.
Step 4: Create a Forecast
Combining historical data, ratios, metrics, and assumptions leads to the formulation of a specific forecast of a company’s future cash flow, income, and balance sheets. The forecasts usually attempt to answer a single question, such as the financial feasibility of an acquisition or a capital expense, or whether to shut down or outsource certain operations. They’re also used to gauge the level of risk involved in a specific transaction.
Step 5: Determine a Value for the Company or Asset
Once the financial forecast is complete, various models can be applied to find the value of a firm, a division, or an asset, typically using the DCF method or the present value of free cash flows.
- The DCF model assumes the company being analyzed will continue to sell its products with no drop in demand, thus guaranteeing a steady cash flow.
- The present value of free cash flows assumes the firm’s management will spend its capital in ways that preserve its cash flow and that the value of the present cash flows exceeds the company’s stock value.
Step 6: Review and Compare Various Resulting Scenarios
The more scenarios the model constructs, the clearer the picture of the future that the financial model generates. It may seem counterintuitive that a model that creates a range of possible future outcomes is considered more accurate than a model that generates a single forecast, but scenario modeling allows analysts to compare many potential eventualities rather than only the one the model identifies as most likely or the best case.
Resources on How to Build Financial Models
- Sturppy, The Best Resources for Startup Financing and Modeling — Resources include scenario planning and analysis, use of artificial intelligence (AI) in financial models, and creating a financial model for a mobile app.
- Verizon, 18 Ways to Make Your Financial Models Stand Out to Investors — Tips include targeting the model to its intended audience, color-coding fonts and other layout elements, and creating an area for assumptions and main drivers.
Common Financial Modeling Techniques
The financial modeling techniques and tools used in business range from the long-time stalwart Microsoft Excel to the latest AI-powered modeling tools. Financial analysts continue to use Excel to create basic financial models despite the growth in financial modeling tools designed to improve business decisions and help companies adapt to rapidly changing industry and economic conditions.
Examples of Excel-based financial model techniques include DCF models and valuation models such as the dividend discount model (DDM) and the comparables model. The standard approach to financial modeling in Excel is to use the x-axis to measure a time period (quarters or years, for example) and the y-axis to show revenue, cost of goods sold (COGS), gross margin, and other financial results. Revenue estimates may be generated on a separate sheet.
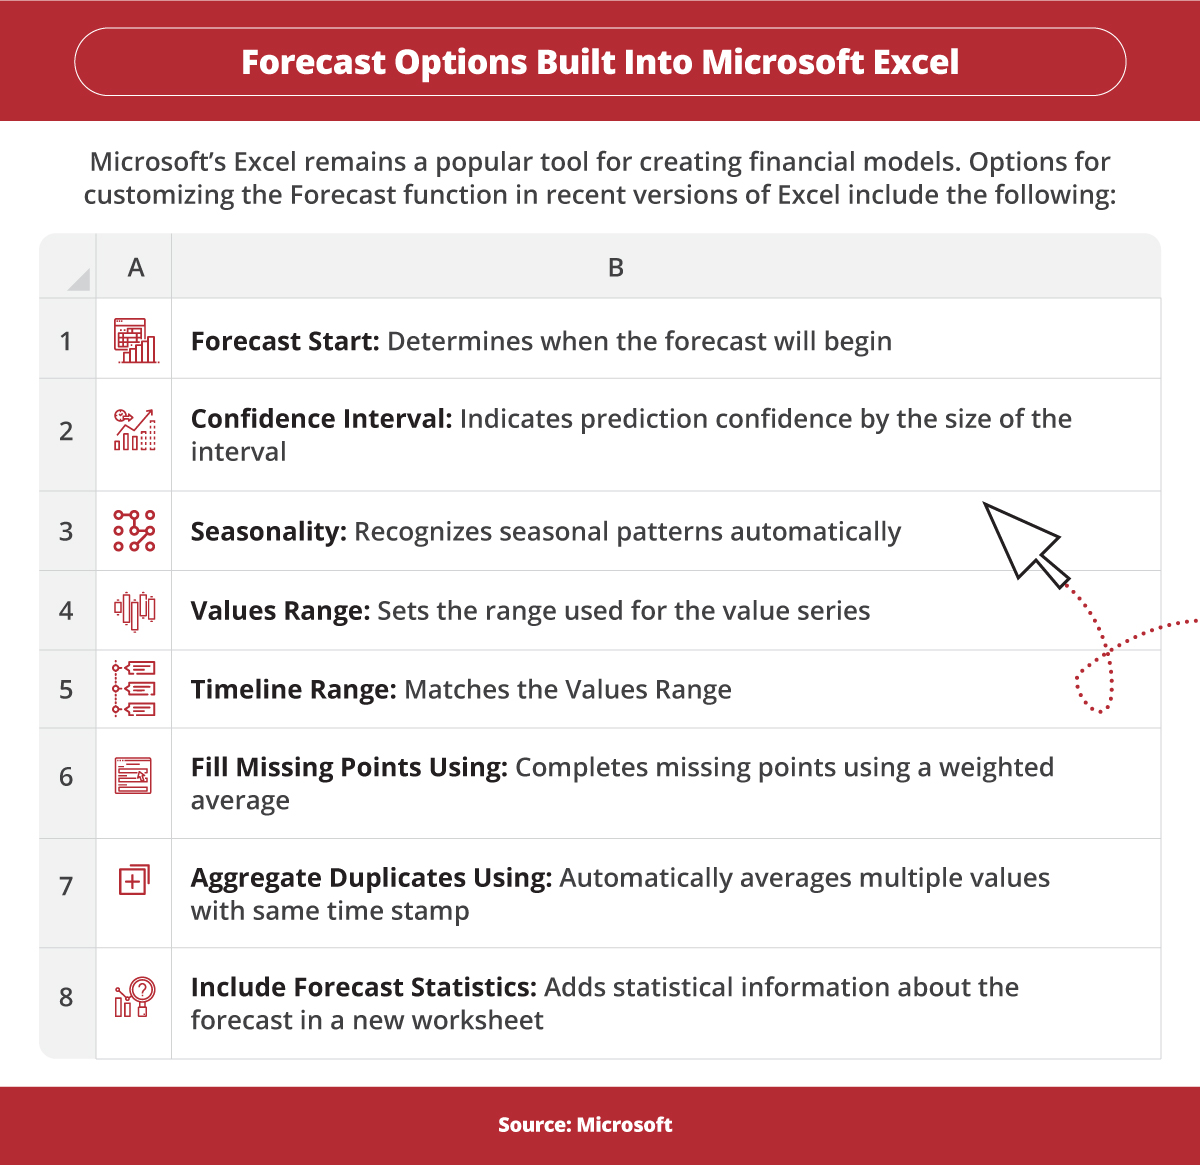
Microsoft’s Excel spreadsheet software remains a popular tool for creating financial models. Options for customizing the Forecast function in recent versions of Excel include the following. Forecast Start: Determines when the forecast will begin. Confidence Interval: Indicates prediction confidence by the size of the interval. Seasonality: Recognizes seasonal patterns automatically. Values Range: Sets the range used for the value series. Timeline Range: Matches the Values Range. Fill Missing Points Using: Completes missing points using a weighted average. Aggregate Duplicates Using: Automatically averages multiple values with the same time stamp. Include Forecast Statistics: Adds statistical information about the forecast in a new worksheet.
The following are among the financial modeling tools that are widely used in business:
Planful
Planful is a financial planning and analysis (FP&A) program based on the concept of continuous planning in all areas of the organization, including budgeting, capital expenses, workforce, and operating expenses. The program gives business managers access to complete financial information updated daily and the ability to generate reports quickly and simply.
Prophix
Prophix is intended to serve as a “virtual financial analyst” that automates many aspects of budgeting and planning, reporting and analytics, financial management, and workflow automation. The system puts all of a company’s financial information in a single location to avoid managers having to open several different Excel spreadsheets to access it. However, some users report that it doesn’t integrate well with Excel.
DataRails
DataRails is a corporate performance management (CPM) solution that generates profit and loss (P&L) statements, balance sheets, and cash flows from figures pulled from the company’s databases in real time. The program is used primarily by midsize firms for budgeting and planning, tracking capital and operational expenses, and automating appreciation and amortization calculations.
Anaplan
Anaplan bills itself as a platform for building hyperscale models that give managers a 360-degree view of their operations to the transaction level. The platform is intended primarily for enterprises to help managers create forecasts quickly and accurately. Among the platform’s popular features are forecasting, scenario modeling, personalized dashboards, and management reporting.
Workday Adaptive Planning
Workday Adaptive Planning is another enterprise planning tool that automates financial modeling via a dashboard interface. The program integrates with many core business systems, such as Salesforce, Oracle, SAP, and Sage Intacct. Customers report that their favorite Workday Adaptive Planning features are forecasting, financial budgeting, long-term financial planning, and management reporting.
Centage Planning Maestro
Centage Planning Maestro financial planning and analysis software supports scenario planning, budgeting, financial forecasting, reporting, and analytics via an intuitive dashboard interface. The cloud-based service is intended to provide enterprise-level modeling features for small and midsize businesses. Among its features are 40 prebuilt reports that are compliant with generally accepted accounting principles (GAAP) and International Financial Reporting Standards (IFRS) that can be exported to Excel and general ledger systems.
OnPlan
OnPlan is designed primarily for sales forecasting and budgeting. It combines the usability of spreadsheets with the speed of custom financial planning and analysis software. Managers can use Excel syntax to create their models while also benefiting from visualizations and scenario generation. Among the application’s features are rolling financial forecasts, template management, budgeting, performance tracking, and management of roles and permissions.
Oracle Essbase and Hyperion
The Oracle Essbase database development system works with Oracle’s Hyperion financial management solution to provide enterprises with business intelligence (BI) tools integrated with financial modeling of data pulled from Oracle databases. One of the strongest features of the Oracle approach to financial modeling, according to users, is the ability to perform multidimensional analyses much more simply than when using a relational database.
Resources on Financial Modeling Techniques
- Layer, “The Guide to Financial Modeling and Forecasting” — A description of several types of financial models and the differences between financial modeling and financial forecasting.
- Modano, Forecasts — An examination of the process of creating an historical and a financial forecast model that maps historical data to forecasts directly, so financial performance can be tracked more accurately over time.
How to Learn Financial Modeling
The two most common ways that business managers learn financial modeling are by taking online courses and by enrolling in a business or a finance degree program.
- The options available for online financial modeling courses range from those that can be completed in a matter of hours to programs that require months to complete. Subjects covered in these courses include Excel skills, business statistics and analysis, and financial modeling for startups and small businesses.
- While traditional colleges and universities rarely offer degree programs in financial modeling, financial analysts and business managers commonly have at least a bachelor’s degree in financial services or a related subject. Courses in such programs typically cover business statistics, securities analysis and investment techniques, financial planning, and portfolio management.
- Among the certifications for financial modeling are the Corporate Finance Institute’s Financial Modeling and Valuation Analyst (FMVA) credential and the International Financial Modeling Institute’s Professional Financial Modeler (PFM) certification.
Financial Modeling Skills Required for Financial Analyst Positions
The duties of financial analysts include determining the value of a company by examining its financial statements, according to the U.S. Bureau of Labor Statistics (BLS). Among the skills necessary to qualify for financial analyst jobs are math, financial analysis software, analytics, decision-making, and communication.
Most financial analysts work for one of three different types of finance and investment firms:
- Buy-side firms are investment companies that manage their own funds.
- Sell-side firms employ analysts to prepare research reports that influence the buy and sell decisions of investors.
- Investment banks and equity firms rely on analysts to model potential mergers and acquisitions, IPOs, and other financial deals between companies.
Resources on How to Learn Financial Modeling
- FinanceWalk, “The Best Way to Learn Financial Modeling in Excel” — Methods include video tutorials, virtual classroom training, use of case studies, and distance learning.
- The Balance, “Best Online Financial Management Courses” — Features online courses focusing on investment banking, modeling in Excel, and modeling for small businesses and startups.
Financial Modeling: A Fundamental Skill for Financial Analysts
As firms of all types and sizes rely increasingly on sophisticated financial models to support their business decisions, the value of financial modeling skills skyrockets. Anyone interested in pursuing a career as a financial analyst or financial planner will find that possessing the ability to construct, run, and analyze financial models can help prepare them for a range of financial and management positions.
Infographic Sources
Excel in Excel, “Financial Modeling Basics for Beginners”
Indeed, “What Is Qualitative Forecasting? Definition and Methods You Can Use”
Microsoft, “Create a Forecast in Excel for Windows”
Zip Forecasting, “5 Most Commonly Used Quantitative Techniques in Business Forecasting”