Top 4 Data Analysis Techniques That Create Business Value
Tables of Contents

According to Accenture, 175 zettabytes of data will exist by 2025, yet a data-value gap — the inability to unlock business value from data — remains. Accenture reports that only 32% of companies can currently extract business value from their data. To maximize opportunities from data, organizations must employ data analysis techniques and make the business case for a data analysis strategy that can help overcome the following challenges:
- Poor data quality. Causes of poor data quality include system problems, human error, and outdated data. According to Gartner, organizations lose about $15 million a year due to poor data quality issues, making the business case for data quality improvement a high priority.
- Absence of an effective data strategy. PwC estimates that organizations can make decisions five times faster with an effective data strategy that ensures the data is protected, of high quality and value, and usable for business purposes.
- Difficulty in finding skilled employees. According to a report from SHRM, 75% of survey respondents say that the global skills shortage has made recruiting qualified candidates more difficult. Data analysis skills are one of the top three missing technical skills, according to the report.
- Lack of executive sponsorship. Companies fail to become data-driven for various reasons. However, building a data-centric culture can only succeed when executives at the highest levels of an organization are committed to unlocking data’s value.
- Data silos. The lack of a single source of truth may result in data silos, disparate collections of information not effectively shared. Effective data governance can break down these data silos and enable organizations to extract business value from their data.
Data-driven companies can extract business value from data through human ingenuity and data analysis, a process of drawing information from data to make informed decisions.
What is data analysis?
Data analysis is a technique that typically involves multiple activities such as gathering, cleaning, and organizing the data. These processes, which usually include data analysis software, are necessary to prepare the data for business purposes. Data analysis is also known as data analytics, described as the science of analyzing raw data to draw informed conclusions based on the data.
Data comes in different structures, formats, and types, including the following:
- Big data. Big data is defined as a huge data set that continues to grow at an exponential rate over time. The four fundamental characteristics of big data are volume, variety, velocity, and variability. Volume describes quantity, velocity refers to the speed of data growth, and variety indicates different data sources. Veracity speaks to the quality of the data, determining if it provides business value or not.
- Structured/unstructured data. Structured data is a predefined data model such as a traditional row-column database. Unstructured data comes in a format that does not fit in rows and columns and can include videos, photos, audio, text, and more. A comparison of structured data versus unstructured data reveals that structured data is easier to manage and analyze.
- Metadata. Metadata is a form of data that describes and provides information about other data. For example, metadata for an image can include the author, image type, and date created. Metadata enables users to organize unstructured data into categories, making it easier to work with.
- Real-time data. Data that is presented as soon as it is acquired is known as real-time data. This type of data is useful when decisions require up-to-the-minute information. For example, a stockbroker can use a stock market ticker to track the most active stocks in real time.
- Machine data. Thanks to the Internet of Things (IoT), sensors, and other technologies, data can be automatically generated by factory systems and other machines, information technology and telecommunications infrastructure, smart cars, hand-held devices, and more. This type of data is known as machine data because it is produced wholly by machines without human instruction.
Data analysis methods and techniques are useful for finding insights in data, such as metrics, facts, and figures. The two primary methods for data analysis are qualitative data analysis techniques and quantitative data analysis techniques. These data analysis techniques can be used independently or in combination with the other to help business leaders and decision-makers acquire business insights from different data types.
Quantitative data analysis
Quantitative data analysis involves working with numerical variables — including statistics, percentages, calculations, measurements, and other data — as the nature of quantitative data is numerical. Quantitative data analysis techniques typically include working with algorithms, mathematical analysis tools, and software to manipulate data and uncover insights that reveal the business value.
For example, a financial data analyst can change one or more variables on a company’s Excel balance sheet to project their employer’s future financial performance. Quantitative data analysis can also be used to assess market data to help a company set a competitive price for its new product.
Qualitative data analysis
Qualitative data describes information that is typically nonnumerical. The qualitative data analysis approach involves working with unique identifiers, such as labels and properties, and categorical variables, such as statistics, percentages, and measurements. A data analyst may use firsthand or participant observation approaches, conduct interviews, run focus groups, or review documents and artifacts in qualitative data analysis.
Qualitative data analysis can be used in various business processes. For example, qualitative data analysis techniques are often part of the software development process. Software testers record bugs — ranging from functional errors to spelling mistakes — to determine bug severity on a predetermined scale: from critical to low. When collected, this data provides information that can help improve the final product.
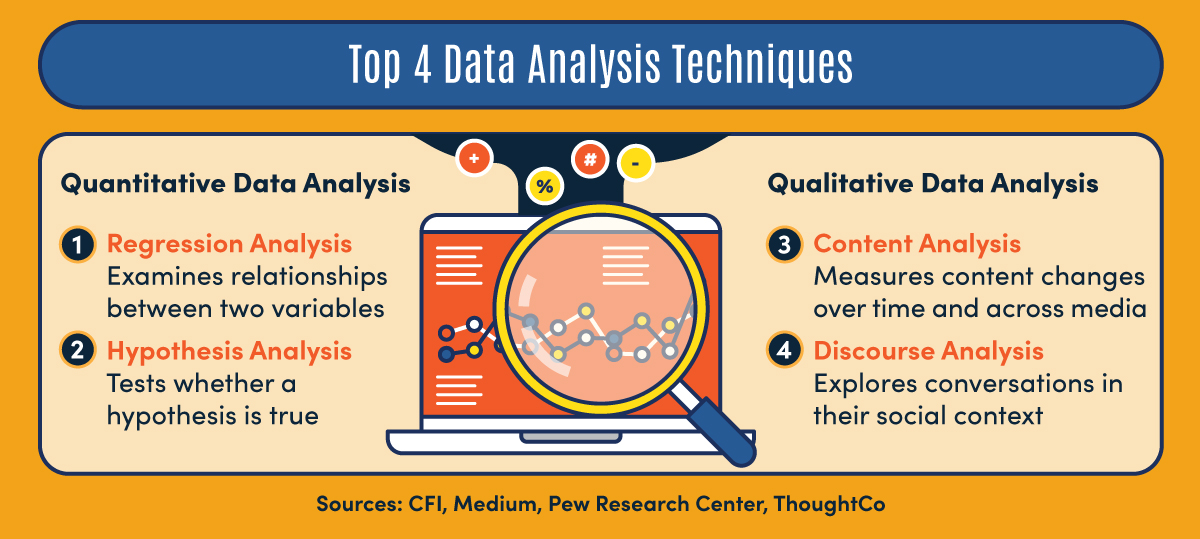
Two data analysis techniques for quantitative data are regression analysis (which examines relationships between two variables) and hypothesis analysis (which tests whether a hypothesis is true). Two data analysis techniques for qualitative data are content analysis (which measures content changes over time and across media) and discourse analysis (which explores conversations in their social context).
Quantitative data analysis techniques
Each of the various quantitative data analysis techniques has a different approach to extracting value from the data. For example, a Monte Carlo Simulation is a quantitative data analysis technique that simulates and estimates the probability of outcomes in uncertain conditions in fields such as finance, engineering, and science. A provider of mobile telecommunications services can use it to analyze network performance using different scenarios to find opportunities to optimize its service. Other quantitative data types and examples include cross-tabulation and trend analysis.
Below are descriptions and typical steps involved in two popular quantitative data analysis techniques: regression analysis and hypothesis analysis.
Regression analysis
Regression analysis is a type of statistical analysis method that determines the relationships between independent and dependent variables. In finance, regression is defined as a method to help investment and financial managers value assets and determine variable relationships in commodity prices and stocks.
Through experiments that involve manipulating the values of independent variables, a quantitative data analyst can assess the impact of the changes on the dependent variable. The process can be thought of in terms of cause and effect. For example, an independent variable can be the amount an individual invests in the stock market with the dependent variable the total amount of money an individual will have when they retire.
The two primary types of regression analysis are simple linear and multiple linear.
Simple linear regression analysis
A simple linear regression analysis formula includes a dependent variable and an independent variable. The mathematical representation of the dependent variable is typically Y, while X represents the independent variable.
An example of the use of linear regression is a market researcher analyzing the relationship between their company’s products and customer satisfaction. By ranking customer satisfaction levels on a scale of 1 to 10, the market researcher can place numerical values on the data collected. Using these quantitative data, they can perform a regression analysis to determine a linear relationship between a product (independent variable) and customer satisfaction (dependent variable).
Multiple linear regression analysis
Multiple linear regression analysis also includes a dependent variable. The main difference is that it contains various independent variables, resulting in a potentially complex formula for performing a regression analysis. However, tools such as Microsoft Excel and statistics software such as SPSS can simplify the task of multiple linear regression analysis.
Hypothesis analysis
Hypothesis analysis is a data analysis technique that uses sample data to test a hypothesis. Hypothesis analysis is a statistical test method to validate an assumption and determine if it’s plausible or factual. In this approach, an analyst develops two hypotheses — only one of them can be true. Two foundational components of hypothesis analysis are the null hypothesis and the alternative hypothesis.
Null hypothesis
The first hypothesis is the null hypothesis. Null means no difference between two groups represented in the data. For example, a null hypothesis would claim that no difference in school achievement exists between students from high-income communities (group 1) and those from low-income areas (group 2). In performing a hypothesis analysis, the aim of the researcher or analyst is to demonstrate that a difference does exist between the groups in the study, therefore rejecting the validity of the null hypothesis.
Alternative hypothesis
The alternative hypothesis is typically the opposite of the null hypothesis. Let’s say that the annual sales growth of a particular product in existence for 15 years is 25%. The null hypothesis in this example is that the mean growth rate is 25% for the product. The aim of a hypothesis analysis is to determine if the null hypothesis is not true. In this example, an analyst uses the alternative hypothesis to test whether the assumed 25% growth rate is accurate. Therefore, the alternative hypothesis is that the growth rate is not 25% for the product. In this example, the random sample can be the product’s growth rate over five years instead of 15 years. At the end of the test, a data analyst can draw a conclusion based on the results.
Qualitative data analysis techniques
Qualitative data analysis techniques are built on two main qualitative data approaches: deductive and inductive.
- Deductive approach. This analysis method is used by researchers and analysts who already have a theory or a predetermined idea of the likely input from a sample population. The deductive approach aims to collect data that can methodically and accurately support a theory or hypothesis.
- Inductive approach. In this approach, a researcher or analyst with little insight into the outcome of a sample population collects the appropriate and proper amount of data about a topic of interest. Then, they investigate the data to look for patterns. The aim is to develop a theory to explain patterns found in the data.
Two main qualitative data analysis techniques used by data analysts are content analysis and discourse analysis. Another popular method is narrative analysis, which focuses on stories and experiences shared by a study’s participants. Below are descriptions and typical steps involved in content analysis and discourse analysis.
Content analysis
Researchers and data analysts can use content analysis to identify patterns in various forms of communication. Content analysis can reveal patterns in recorded communication that indicate the purpose, messages, and effect of the content.
Content analysis can also help determine the intent of the content producers and the impact on target audiences. For example, content analysis of political messages can provide qualitative insights about employment policy amid the COVID-19 pandemic. An analyst could identify instances where the word “employment” appears in social media, news stories, and other media and correlates with other relevant terms, such as “economy,” “business,” and “Main Street.” An analyst can then study the relationships between these keywords to better understand a political campaign’s intention with its messages.
The content analysis process contains several components, including the following:
Identify data sources
The first step in the content analysis process is to select the type of content to be analyzed. Sources can range from text found in written form from books, newspapers, and social media posts to visual form found in photographs and video.
Determine data criteria
This step involves determining what will make a particular text relevant to the study. Questions to assess data criteria can include: Does the text mention a specific topic or connote an event related to the issue? Does it fall within a specified date range or geographic location?
Develop coding for the data
Since qualitative data is not numerical, it needs to be codified in preparation for measurement. This requires developing a set or system of codes to categorize the data. Once the coding system is developed, relevant codes can be applied to specific texts.
Analyze the results
All the work in the previous steps leads to the data examination process. Data analysts look for patterns and correlations in the data to interpret results and make conclusions. They can incorporate statistical techniques for data analysis to draw insights from the data further.
Discourse analysis
A message is not always what it seems, so “reading between the lines,” or the ability to determine underlying messages in communication, is essential. When communications, whether verbal or written, have an indirect or underlying message, it can be interpreted one way by one group and in an entirely different way by another, potentially leading to a breakdown in civil discourse.
Discourse analysis helps provide an understanding of the social and cultural context of verbal and written communication throughout conversations. Discourse analysis aims to investigate the social context of communication and how people use language to achieve their aims, such as evoking an emotion, sowing doubt, or building trust. Discourse analysis analyzes verbal and nonverbal cues. For example, the way a speaker pauses on a particular word or phrase can reveal insights into the speaker’s intent or attitude toward that phrase.
Discourse analysis helps interpret the true meaning and intent of communication and clarifies misunderstandings. For example, an analysis of transcripts of conversations between a physician and a patient can reveal whether the patient truly understood a diagnosis.
An analyst can distinguish subtle subtext in communication through discourse analysis to differentiate whether the content is fact, fiction, or propaganda.
Steps in discourse analysis include:
Define the research question
Defining the research question determines the aim of the investigation and provides a clear purpose. The research question will guide the analysis.
Select the content types
Materials used for investigation can include social media text, speeches, messaging in marketing brochures, press releases, and more.
Collect the data
The content collected for the analysis typically focuses on a subject delivering the message (such as a political leader or company) and its targeted audience (citizens and customers, for example).
Analyze the content
Words, phrases, sentences, and content structure can reveal patterns in the subject’s attitudes and intent with their message and the audience’s response or reaction.
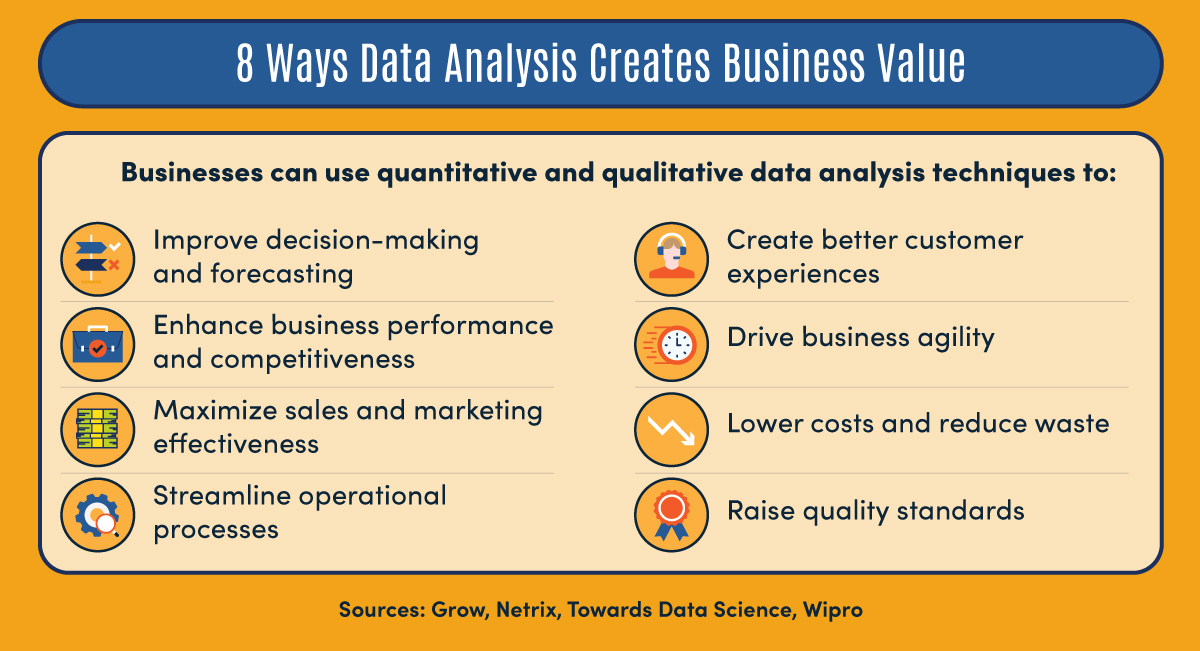
Businesses can use quantitative and qualitative data analysis techniques to improve decision-making and forecasting, enhance business performance and competitiveness, maximize sales and marketing effectiveness, streamline operational processes, create better customer experiences, drive business agility, lower costs and reduce waste, and raise quality standards.
A closer look at statistical techniques for data analysis
Statistical techniques use mathematical approaches to provide insights, observations, and conclusions. The processes encompass testing hypotheses and making estimates and predictions of unknown data or quantities. Statistical techniques for data analysis can help decision-makers in various ways, such as determining the risk of different business scenarios or forecasting sales in changing market conditions.
Quantitative data is numerical, therefore, it can be analyzed using statistical analysis techniques to find patterns or meaning. Qualitative data can also be analyzed using statistical analysis techniques. But since qualitative data is typically nonnumerical, it must first be classified and grouped into meaningful categories.
Statistical techniques used in both qualitative and quantitative data analysis include grounded theory and cross-tabulation.
Grounded theory
This systematic inductive approach gathers, synthesizes, analyzes, and conceptualizes qualitative and quantitative data. Analysts using a grounded theory approach observe the data and identify patterns before developing a theory. This type of approach is typical in qualitative research.
Quantitative methods are typically structured the opposite way; first, a theory is developed and then the data is observed for patterns. Grounded theory research methods are useful when data about a particular topic is scarce. The grounded theory approach’s flexibility enables researchers to find patterns, trends, and relationships in both qualitative and quantitative data. Based on the findings, an investigator builds a theory founded or “grounded” in the data.
Cross-tabulation
This data analysis technique provides information about the relationship between different variables in a table format. It allows researchers to observe two or more variables simultaneously. The data is classified according to at least two categorical variables, represented as rows and columns. Therefore, each variable must be classified under at least two categories.
For example, cross-tabulation can be useful in marketing and for reviewing customer feedback. A column can provide values indicating whether a customer was satisfied or dissatisfied with their experience. A row can present variables identifying the type of customer (online or in store, for example). A statistical analysis of the data can reveal insights from tables populated with a lot of data. For example, the Chi-square is a statistical hypothesis technique that allows analysts to observe values and draw conclusions across more than one category, providing valuable business insight.
Unlocking the business value of data analysis techniques
Businesses have a treasure trove of data within reach thanks to digital music, movies, television, and games, and the digitization of business processes. The data is generated every day by users of mobile phones and PCs, IoT-powered machines, and other devices.
Big data’s fast and evolving nature makes it difficult to manage and analyze with traditional data management software. Data analysis techniques play a key role in turning the research data into meaningful insights to help in business decision-making. The insights derived from the data can lead to revenue growth, improved marketing and operational performance, and stronger customer relationships, making data analysis a key skill for creating business value.
Infographic Sources
Grow, “Why Is Data Important for Your Business?”
Medium, “Hypothesis Analysis Explained”
Netrix, “10 Ways Data Analytics Can Revolutionize Your Business Strategy”
Pew Research Center, “Content Analysis”
ThoughtCo, “Understanding the Use of Language Through Discourse Analysis”
Towards Data Science, “Effective Ways How Data Analytics Help to Make a Better Entrepreneur”